 Welcome to the Debugmen blog. We use this site to post tools, security findings, CTF writeups and anything else we find worthy of release to the public.
Enabot Hacking: Part 2.0 - Debugging
Enabot Hacking: Part 2 -> Reverse Engineering
The section below is kept for completeness, but we don’t use this method anymore as we found a better one later on. For how we actually disable the watchdog, see here
Software debugging
In the last post we mentioned hardware debugging, we realized there was also another option which is software debugging. We have a shell so if we can find a binary of gdbserver that runs on the device, we can attach the firmware to it and debug it. Then we can simply break at the start of the charlie_scramble function and check argument 1 to see the packet before it gets XORed and/or scrambled.
Playoff-rondo sent us a repo of statically compiled gdbservers, and we found that the gdbserver-7.7.1-armel-eabi5-v1-sysv worked on the device since it was armv5t.
We netcated the file to the device. Most of the device was readonly so we couldn’t move the file, but because there is a place for the SD card, we can put the file there.
On enabot ssh shell
- nc -l -p 1234 > gdbserver
On host PC
- nc -w 3 X.X.X.X 1234 < gdbserver-7.7.1-armel-eabi5-v1-sysv
Now that we have the file, we can attach it to the FW_ENABOT_C process and start debugging. The process ID was 541
./gdbserver --attach X.X.X.X:5555 541
Then in gdb-multiarch, we can simply do
target remote X.X.X.X 5555
It loads some symbols and other stuff, but after a bit, we are in the debugger! Or at least for a few seconds….
Bypassing the watchdog
It turns out this firmware uses a watchdog, and the timer is set to about 10 seconds. Every few seconds the firmware will reach out to the watchdog and say that it’s doing okay, but when we’re debugging it, the process is halted. Because the watchdog doesn’t get it’s okay message, it restarts the device.
We spent a lot of time trying to get around this. We tried disabling the kernel watchdogs with sysctl, we tried writing “V” to /dev/watchdog, but the file was busy, and a few other things that came up in google searches, but none of it worked.

We figured since the firmware would open the file and store the file pointer in memory somewhere. If we could just use that file pointer, maybe we could write the “V” character which supposedly disables the watchdog timer after it is activated.
In ghidra we found where it opened the watchdog file:
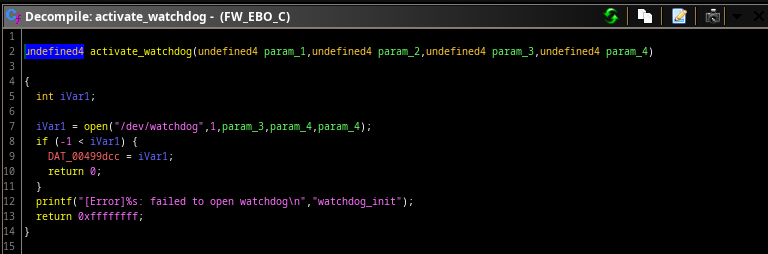
We can see it stores the pointer at 0x00499dcc. When we look at the XREFs of that pointer, we came across another function.
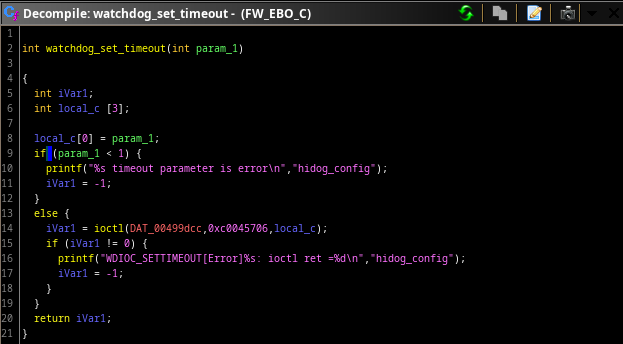
Looks like we can just use this function. If we act quickly enough into the debugger, we can save all the registers, set the argument of this function to some really large number, execute it, and then restore the registers to go back to normal execution.
We did some more research and figured out the ioctl function is what really writes to the file. Looking at the kernel watchdog code and comparing it to the enabot value it sends to IOCTL, it looks like the last digit of the 0xc0045706 controls what functionality it does (the activate and write values in the other functions also lined up).
https://www.kernel.org/doc/Documentation/watchdog/watchdog-api.txt
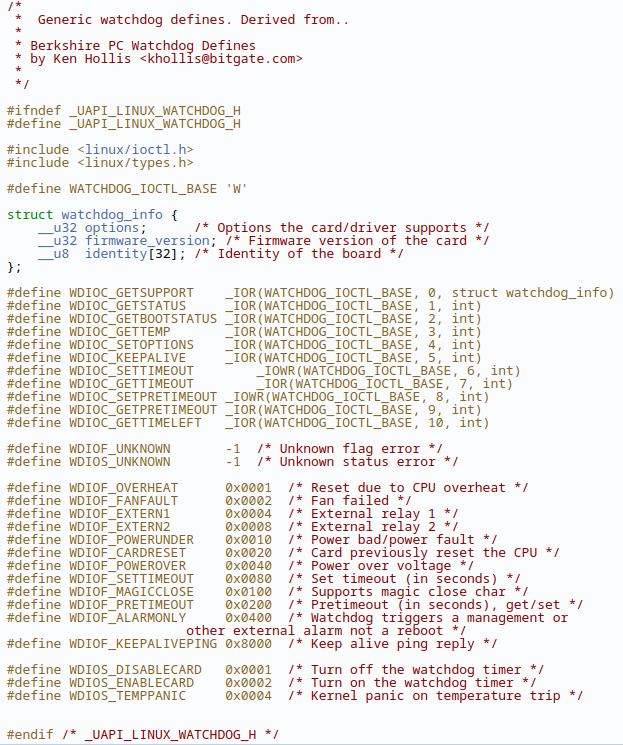 “6” is for setting the watchdog timeout. We tried modifying that value to “4” for the set options functionality and then using the disable card option to disable the watchdog timer, but couldn’t get it to work. The device was still restarting.
Setting the registers every time we wanted to debug was tedious, so wrote a gdb script to automate the entire process of attching the debugger, setting the registers, and returning back.
Python gdb script
```python
import os
import signal
import time
import paramiko
import gdb
import argparse
import sys

SET_WATCHDOG_TIMEOUT_START=0x000f3e6c
SET_WATCHDOG_TIMEOUT_END=0x000f3e94
WATCHDOG_VALUE_POINTER=0x000710f8 #Set to 0xFFFFFFFF

def attach_gdb_server(remote_ip, host_ip, ssh_pass):
    ssh = paramiko.SSHClient()
    ssh.set_missing_host_key_policy(paramiko.AutoAddPolicy())
    print("Waiting for target's SSH to go up")
    ssh.connect(hostname=remote_ip, port=22, username='root', password=ssh_pass)
    print("Connected to target over ssh")
    stdin, stdout, stderr = ssh.exec_command('ps')
    lines = stdout.readlines()
    for line in lines:
        if "FW_EBO_C" in line:
            pid = line.split()[0]
            print(f'Found FW_EBO_C pid: {pid}')
    print(f"Attaching FW_EBO_C({pid}) to gdbserver")
    ssh.exec_command(f"/var/avi/mmc0/DICM/gdbserver --attach {host_ip}:5555 {pid}")
    ssh.exec_command('sysctl -w "kernel.watchdog=0"')
    ssh.exec_command('sysctl -w "kernel.nmi_watchdog=0"')
    ssh.exec_command('sysctl -w "kernel.soft_watchdog=0"')
    line = stderr.readline()
    if "Address already in use" in line:
        print("GDB already set on device")
    ssh.close()
    print("Debugger attached")
    return

def bypass_watchdog(remote_ip):
    print("Connecting to remote target")
    value = gdb.execute(f"target remote {remote_ip}:5555")
    registers = dict.fromkeys(["r0", "r1", "r2", "r3", "r4", "r5", "r6", "r7", "r8", "r9", "r10", "r11", "r12", "sp", "lr", "pc"], None)
    print(registers)
    print("Continuing execution")
    for register in registers:
        value = gdb.parse_and_eval(f"${register}")
        registers[register] = value
        print(f'Saved register {register} with value {value}')

    # TESTING DISABLE ################
    # Can't get this to work. Maybe they didn't include it?
    # print("Disabling the watchdog timer")
    # gdb.execute(f'set $pc = {SET_WATCHDOG_TIMEOUT_START}')
    # gdb.execute('set $r0 = 0x1')
    # gdb.execute('set $r1 = 0x80045704')
    # gdb.execute('set $r2 = 0x00347914')
    # gdb.execute('break *0x000f3e8e')

    # THIS WORKS #################
    print('Calling "watchdog_set_timeout(0xFFFFFFFF)"')
    gdb.execute(f'set $r0 = {WATCHDOG_VALUE_POINTER}')
    gdb.execute(f'set $pc = {SET_WATCHDOG_TIMEOUT_START}')
    gdb.execute(f'break *{SET_WATCHDOG_TIMEOUT_END}')
    ################
    gdb.execute('c')
    print("Restoring context")
    for register in registers:
        gdb.execute(f'set ${register} = {registers[register]}')
        print(f"Restoring register {register} with value {hex(registers[register])}")
    print("Breaking at charlie_scramble()")
    gdb.execute("break *0x00149b0c")
    gdb.execute("c")

def main():
    remote_ip = arg0
    host_ip = arg1
    ssh_pass = arg2

    attach_gdb_server(remote_ip, host_ip, ssh_pass)
    bypass_watchdog(remote_ip)

if __name__ == '__main__':
    main()
This is used in conjunction with a bash script because sending arguments to a gdb script inside of gdb isn’t a thing apparently.
Bash script for debugging
#!/usr/bin/env bash
doc="
./debug.sh gdb_debug_script.py 'target_ip' 'host_ip' 'ssh_password'
"

py="$1"
shift
cli=''
temp=''
i=0
for arg in "$@"; do
  temp="$arg"
  cli="$cli -ex 'py arg$i = \"$temp\"'"
  echo $cli
  echo $i
  i=$(($i+1))
done
echo "Calling gdb"
echo "gdb $cli -x '$py FW_EBO_C'"
eval gdb-multiarch  $cli -x "$py " "FW_EBO_C"
Now if we run the bash script, it’ll do the following
- SSH into device and attach gdbserver to the FW_EBO_C PID shown in the
pscommand to my host ip on port - Close the SSH connection
- Open gdb and target remote to the device
- Save all the registers at the breakpoint
- Set r0 to an address where the value is 0xFFFFFFFF
- Set a breakpoint at the end of the set_watchdog_timeout function and then set the PC register to the starting address of it
- Continue until it hits that breakpoint
- Restore the registers, and then break at the first instance of the charlie_scramble function
After doing this it works! Mostly… The device will still restart after about 5-10 minutes, but it’s a long enough window to comfortably debug something as simple as this. If it really becomes an issue we could look more into the disable watchdog command or make a script to automatically ping the watchdog every so often.
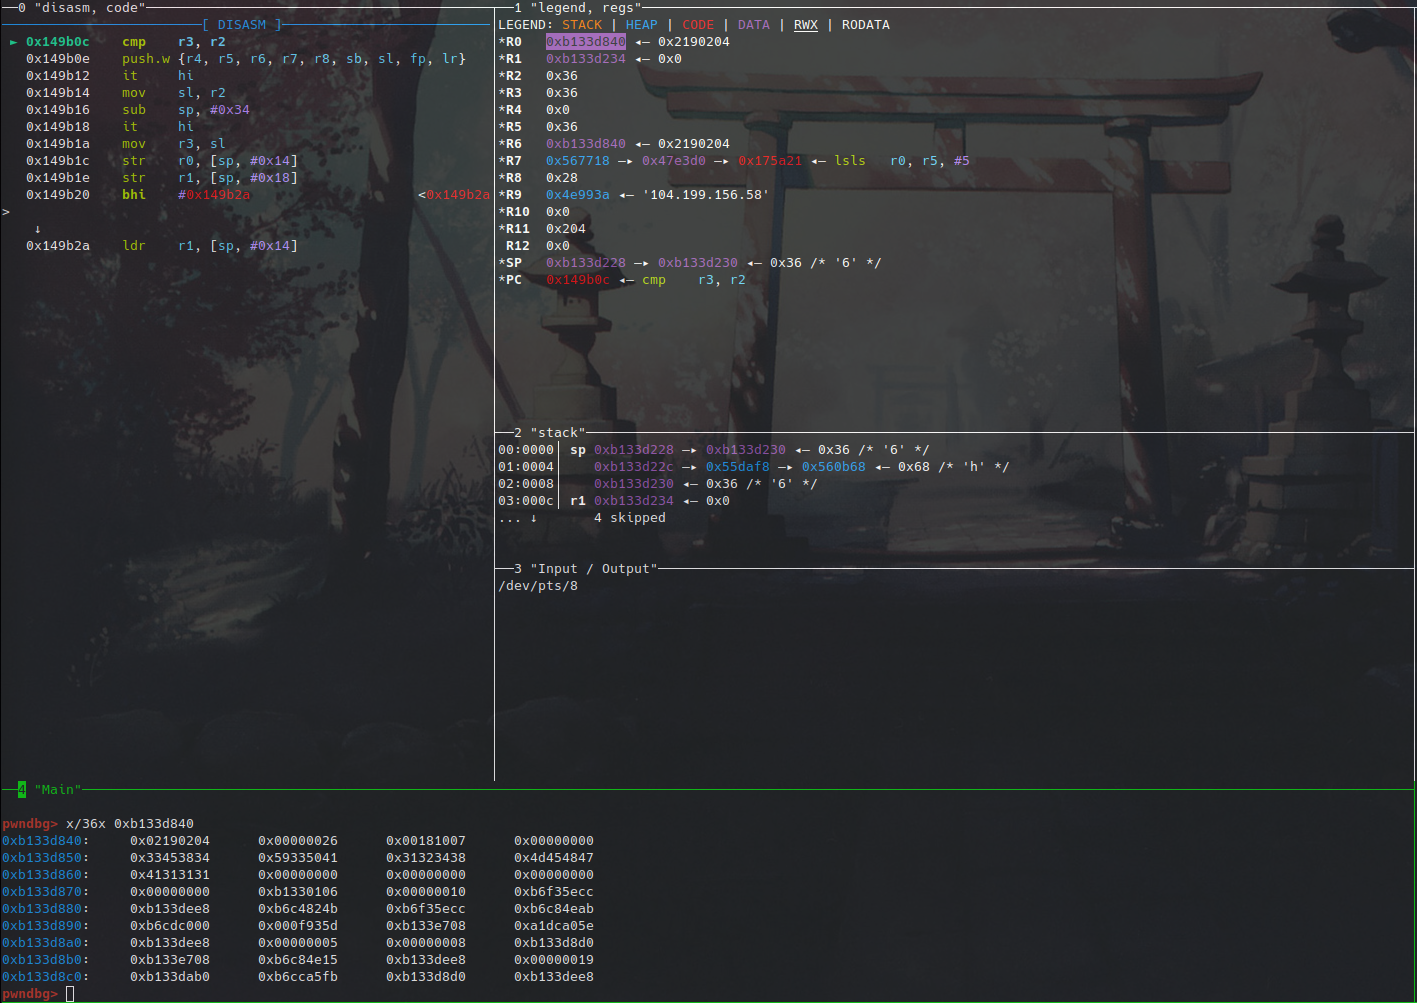
Back to the packet analysis. So after hitting the breakpoint at the beginning of the charlie scramble function, we dumped out the bytes of the input packet to be scrambled, set a breakpoint at the end of the function, and dumped the bytes of the scrambled output bytes when it got there. Then we continued and watched the packet appear in wireshark after setting the filter to be only udp packets.
Before scramble
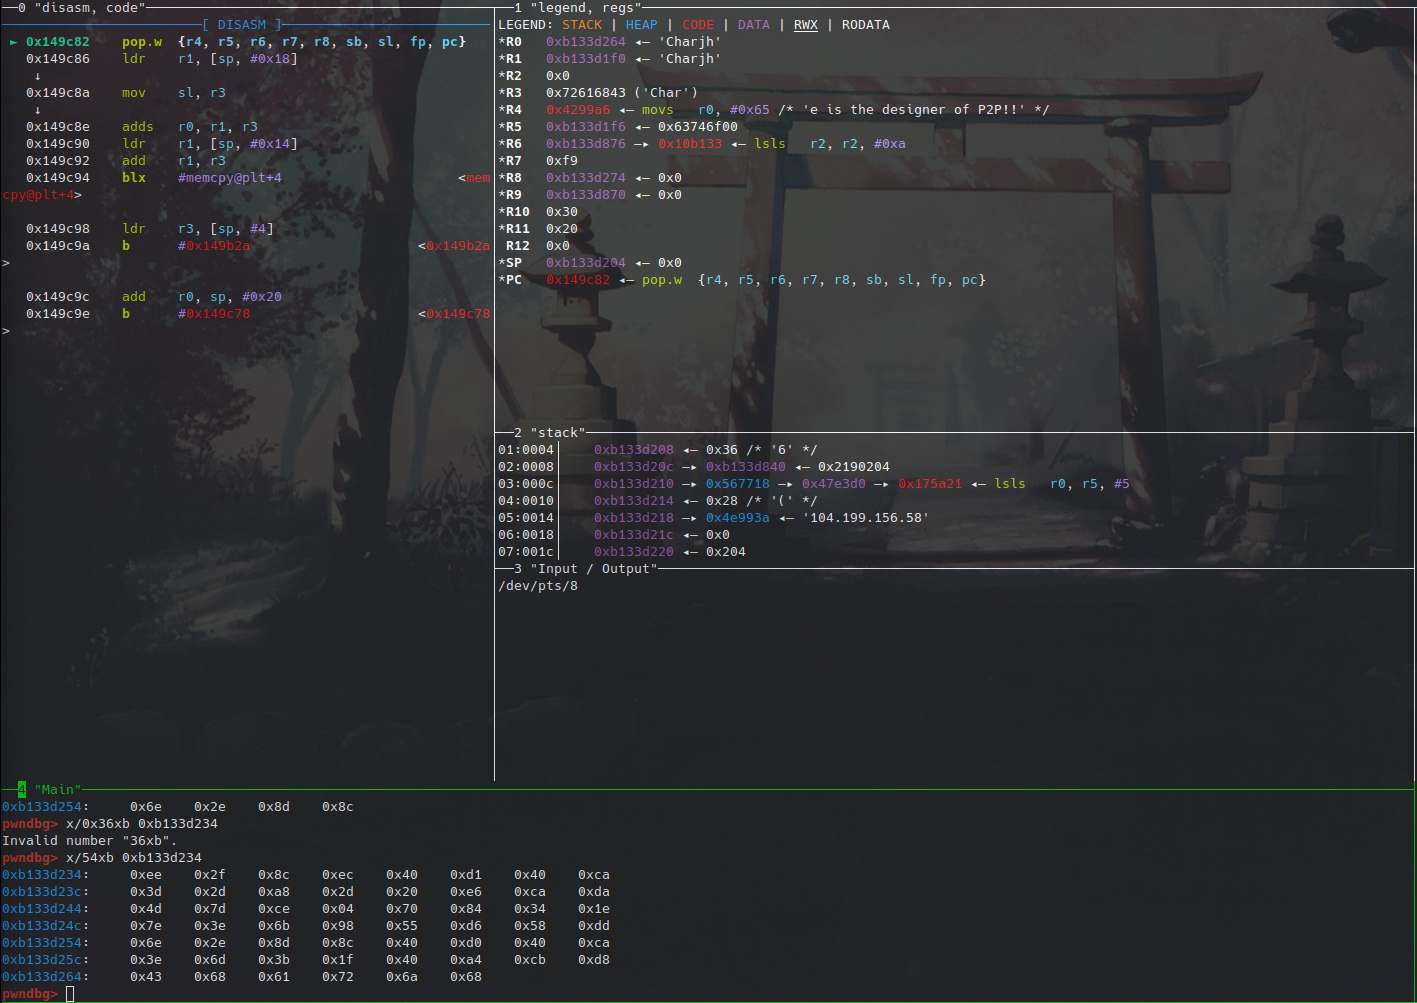
 After scramble
 Wireshark scramble capture
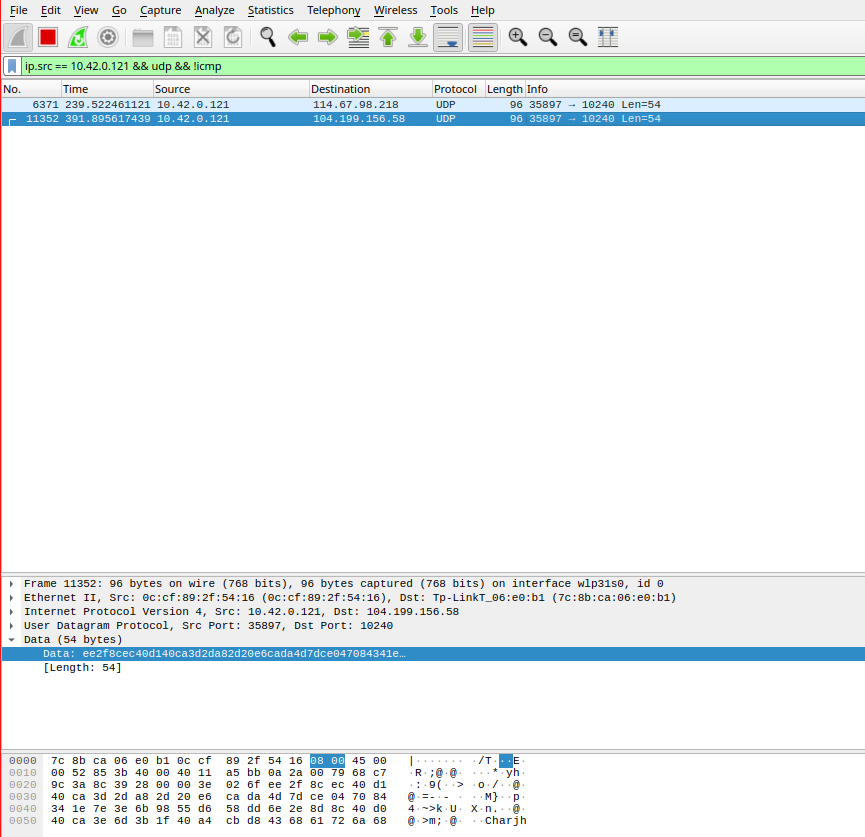
Comparing the bytes at the bottom of the after scramble image and the wireshark image, we see that they match. This means we can successfully capture the packet before it gets encrypted. Now the only issue is the decrypted bytes still don’t mean anything. We were hoping they’d be in some simple format like JSON or something, but they’re completely random bytes. Maybe this is only for raw video data and if we capture a packet of the device moving forward, it’ll be in a better format.
Current watchdog disable method
We thought that there was something else going on with why we couldn’t disable the watchdog, because when we killed the EBO process, we still couldn’t disable it. It turns out that wpa_supplicant also had a handle to the watchdog. If we kill both these processes, our ssh session stays alive.
We then start a new process that takes up a handle to the watchdog:
#include <stdio.h>
#include <sys/ioctl.h>
#include <fcntl.h>
#include <unistd.h>

int main() {
    int fd = open("/dev/watchdog", 1);
    while(1) {
        if (fd < 0) {
            printf("Failed to open watchdog handle.\n");
            return 1;
        }
        int timeout = 0x000710f8;
        int success = ioctl(fd, 0xC0045706, &timeout);
        if (success) {
            printf("hit the doge\n");
        } else {
            printf("doge missssss\n");
        }
        sleep(1);
    }
    return 0;
}
After launching this, we can restart the EBO process, which will also restart wpa_supplicant.
We automate it like this:
#!/bin/sh

echo "Killing watchdog users..."
kill -9 $(fuser /dev/watchdog)
echo "Starting hit_doge..."
sleep 5
/var/avi/mmc0/hit_doge >& /dev/null &
echo "Starting FW_EBO_C..."
sleep 5
/usr/userfs/bin/FW_EBO_C &
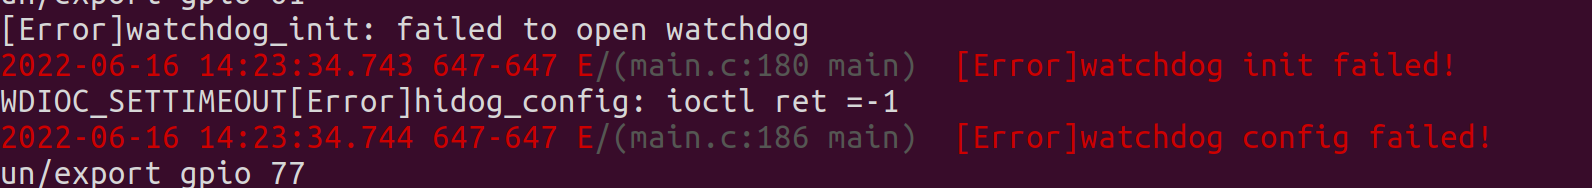
With this we also can see the stdout of the process, which also helps us for debugging. ;)
We see in the stdout of the EBO process it complaining about not being able to get a handle to watchdog, but it doesn’t treat it as a critical error and continues initializing the enabot.